Spectrophores™
Introduction
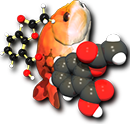
Spectrophores[1] are one-dimensional descriptors generated from the property fields surrounding the molecules. This technology allows the accurate description of molecules in terms of their surface properties or fields. Comparison of molecules’ property fields provides a robust structure-independent method of aligning actives from different chemical classes. When applied to molecules such as ligands and drugs, Spectrophores can be used as powerful molecular descriptors in the fields of chemoinformatics, virtual screening, and QSAR modeling.

Commercial support for Spectrophores is available from Silicos NV, the developers of the Spectrophore technology.
Silicos is a fee-for-service company empowering open source chemo-informatics virtual screening technologies for the discovery of novel lead compounds and database characterization. Silicos fully endorses the concept of open innovation and open source software development, and provides its clients with a wide variety of computational chemistry-based lead discovery services, including Open Babel support, training and code development. Please visit Silicos for more details.
The computation of Spectrophores is independent of the position and orientation of the molecule and this enables easy and fast comparison of Spectrophores between different molecules. Molecules having similar three-dimensional properties and shapes always yield similar Spectrophores. A Spectrophore is calculated by surrounding the three-dimensional conformation of the molecule by a three-dimensional arrangement of points, followed by calculating the interaction between each of the atom properties and the surrounding the points. The three-dimensional arrangement of the points surrounding the molecule can be regarded as an ‘artificial’ cage or receptor, and the interaction calculated between the molecule and the cage can be regarded as an artificial representation of an affinity value between molecule and cage. Because the calculated interaction is dependent on the relative orientation of the molecule within the cage, the molecule is rotated in discrete angles and the most favorable interaction value is kept as final result. The angular stepsize at which the molecule is rotated along its three axis can be specified by the user and influences the accuracy of the method.
The Spectrophore code was developed by Silicos NV, and donated to the OpenBabel project in July 2010 (see sidebar for information on commercial support). Spectrophores can be generated either using the command-line application obspectrophore (see next section) or through the API (OBSpectrophore, as described in the :obapi:`API documentation <OBSpectrophore>`).
obspectrophore
Usage
obspectrophore -i <input file> [options]
Parameter details
| -i <input file> | |
Specify the input file Spectrophores will be calculated for each molecule in the input file. The filetype is automatically detected from the file extension. | |
| -n <type> | The type of normalization that should be performed Valid values are (without quotes):
|
| -a <accuracy> | The required accuracy expressed as the angular stepsize Only the following discrete values are allowed: 1, 2, 5, 10, 15, 20 (default), 30, 36, 45, 60 |
| -s <type> | The kind of cages that should be used The cage type is specified in terms of the underlying pointgroup: P1 or P-1. Valid values are (without quotes):
|
| -r <resolution> | |
The required resolution expressed as a real positive number The default value is 3.0 Angstrom. Negative values or a value of 0 generates an error message. | |
| -h | Displays help |
Implementation
Atomic properties
The calculation of a Spectrophore™ starts by calculating the atomic contributions of each property from which one wants to calculate a Spectrophore. In the current implementation, four atomic properties are converted into a Spectrophore; these four properties include the atomic partial charges, the atomic lipophilicities, the atomic shape deviations and the atomic electrophilicities. The atomic partial charges and atomic electrophilicity properties are calculated using the electronegativity equalisation method (EEM) as described by Bultinck and coworkers [bll2002] [blc2003]. Atomic lipophilic potential parameters are calculated using a rule-based method. Finally, the atomic shape deviation is generated by calculating, for each atom, the atom’s deviation from the average molecular radius. This is done in a four step process:
- The molecular center of geometry (COG) is calculated
- The distances between each atom and the molecular COG are calculated
- The average molecular radius is calculated by averaging all the atomic distances
- The distances between each atom and the COG are then divided by the average molecular radius and centered on zero
Interaction between the atoms and cage points
Following the calculation of all required atomic properties, the next step in the calculation of a Spectrophore consists of determining the total interaction value V(c,p) between each of the atomic contributions of property p with a set of interaction points on an artificial cage c surrounding the molecular conformation.
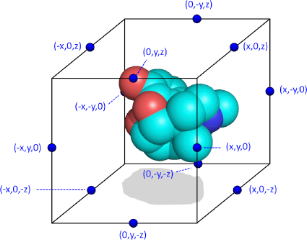
Schematic representation of a molecule surrounded by the artifical cage
For this purpose, each of these interaction points i on cage c is assigned a value P(c,i) which is either +1 or -1, with the constraint that the sum of all interaction points on a particular cage should be zero. In a typical Spectrophore calculation, a cage is represented as a rectangular box encompassing the molecular conformation in all three dimensions, with the centers of the box edges being the interaction points. Such a configuration gives twelve interaction points per cage, and, in the case of a non-stereospecific distribution of the interaction points, leads to 12 different cages. Although there are no particular requirements as to the dimensions of the rectangular cage, the distance between the interaction points and the geometrical extremes of the molecule should be such that a meaningful interaction value between each cage point and the molecular entity can be calculated. In this respect, the default dimensions of the cage are constantly adjusted to enclose the molecule at a minimum distance of 3 A along all dimensions. This cage size can be modified by the user and influences the resolution of the Spectrophore.
The total interaction value V(c,p) between the atomic contribution values A(j,p) of property p for a given molecular conformation and the cage interaction values P(c,i) for a given cage c is calculated according a standard interaction energy equation. It takes into account the Euclidean distance between each atom and each cage point. This total interaction V(c,p) for a given property p and cage c for a given molecular conformation is minimized by sampling the molecular orientation along the three axis in angular steps and the calculation of the interaction value for each orientation within the cage.
The final total interaction V(c,p) for a given cage c and property p corresponds to the lowest interaction value obtained this way, and corresponds to the c’th value in the one-dimensional Spectrophore vector calculated for molecular property p. As a result, a Spectrophore is organized as a vector of minimized interaction values V, each of these organized in order of cages and property values. Since for a typical Spectrophore implementation twelve different cages are used, the total length of a Spectrophore vector equals to 12 times the number of properties. Since four different properties are used in the current implementation (electrostatic, lipophilic, electrophilic potentials, and an additional shape index as described before), this leads to a total Spectrophore length of 48 real values per molecular conformation.
Since Spectrophore descriptors are dependent on the actual three-dimensional conformation of the molecule, a typical analysis includes the calculation of Spectrophores from a reasonable set of different conformations. It is then up to the user to decide on the most optimal strategy for processing the different Spectrophore vectors. In a typical virtual screening application, calculating the average Spectrophore vector from all conformations of a single molecule may be a good strategy; other applications have benefit from calculating a weighted average or the minimal values. For each molecule in the input file, a Spectrophore is calculated and printed to standard output as a vector of 48 numbers (in the case of a non-stereospecific Spectrophore. The 48 doubles are organised into 4 sets of 12 doubles each:
- numbers 01-11: Spectrophore values calculated from the atomic partial charges;
- numbers 13-24: Spectrophore values calculated from the atomic lipophilicity properties;
- numbers 25-36: Spectrophore values calculated from the atomic shape deviations;
- numbers 37-48: Spectrophore values calculated from the atomic electrophilicity properties;
Choice of Parameters
Accuracy
As already mentioned, the total interaction between cage and molecule for a
given property is minimized by sampling the molecular orientation in angular
steps of a certain magnitude. As a typical angular step size, 20 degrees was found to
be the best compromise between accuracy and computer speed. Larger steps sizes
are faster to calculate but have the risk of missing the global interaction
energy minimum, while smaller angular steps sizes do sample the rotational space
more thoroughly but at a significant computational cost. The accuracy can be
specified by the user using the -a option.
Resolution
Spectrophores capture information about the property fields surrounding the
molecule, and the amount of detail that needs to be captured can be regulated by
the user. This is done by altering the minimal distance between the molecule and
the surrounding cage. The resolution can be specified by the user with the
-r option. The default distance along all dimensions is 3.0 Angstrom.
The larger the distance, the lower the resolution.
With a higher resolution, more details of the property fields surrounding the molecule are contained by the Spectrophore. On the other hand, low resolution settings may lead to a more general representation of the property fields, with little or no emphasis on small local variations within the fields. Using a low resolution can be the method of choice during the initial virtual screening experiments in order to get an initial, but not so discriminative, first selection. This initial selection can then further be refined during subsequent virtual screening steps using a higher resolution. In this setting, small local differences in the fields between pairs of molecules will be picked up much more easily.
The absolute values of the individual Spectrophore data points are dependent on the used resolution. Low resolution values lead to small values of the calculated individual Spectrophore data points, while high resolutions will lead to larger data values. It is therefore only meaningful to compare only Spectrophores that have been generated using the same resolution settings or after some kind of normalization is performed. Computation time is not influenced by the specified resolution and hence is identical for all different resolution settings.
Stereospecificity
Some of the cages that are used to calculated Spectrophores have a
stereospecific distribution of the interaction points. The resulting
interaction values resulting from these cages are therefore sensitive to the
enantiomeric configuration of the molecule within the cage. The fact that both
stereoselective as well as stereo non-selective cages can be used makes it
possible to include or exclude stereospecificity in the virtual screening
search. Depending on the desired output, the stereospecificity of
Spectrophores can be specified by the user using the -s option:
- No stereospecificity (default):
- Spectrophores are generated using cages that are not stereospecific. For most applications, these Spectrophores will suffice.
- Unique stereospecificity:
- Spectrophores are generated using unique stereospecific cages.
- Mirror stereospecificity:
- Mirror stereospecific Spectrophores are Spectrophores resulting from the mirror enantiomeric form of the input molecules.
The differences between the corresponding data points of unique and mirror stereospecific Spectrophores are very small and require very long calculation times to obtain a sufficiently high quality level. This increased quality level is triggered by the accuracy setting and will result in calculation times being increased by at least a factor of 100. As a consequence, it is recommended to apply this increased accuracy only in combination with a limited number of molecules, and when the small differences between the stereospecific Spectrophores are really critical. However, for the vast majority of virtual screening applications, this increased accuracy is not required as long as it is not the intention to draw conclusions about differences in the underlying molecular stereoselectivity. Non-stereospecific Spectrophores will therefore suffice for most applications.
Normalisation
It may sometimes be desired to focus on the relative differences between the
Spectrophore data points rather than focussing on the absolute differences.
In these cases, normalization of Spectrophores may be required. The current
implementation offers with the -n option the possibility to normalize in four
different ways:
- No normalization (default)
- Normalization towards zero mean
- Normalization towards standard deviation
- Normalization towards zero mean and unit standard deviation
In all these cases, normalization is performed on a ‘per-property’ basis, which means that the data points belonging to the same property set are treated as a single set and that normalization is only performed on the data points within each of these sets and not across all data points.
Normalization may be important when comparing the Spectrophores of charged molecules with those of neutral molecules. For molecules carrying a global positive charge, the resulting Spectrophore data points of the charge and electrophilicity properties will both be shifted in absolute value compared to the corresponding data points of the respective neutral species. Normalization of the Spectrophores removes the original magnitude differences for the data points corresponding to the charge and electrophilicity properties of charged and neutral species. Therefore, if the emphasis of the virtual screening consists of the identification of molecules with similar property fields without taking into account differences in absolute charge, then Spectrophores should be normalized towards zero mean. However, if absolute charge differences should be taken into account to differentiate between molecules, unnormalized Spectrophores are recommended.
| [bll2002] | P. Bultinck, W. Langenaeker, P. Lahorte, F. De Proft, P. Geerlings, C. Van Alsenoy, and J. P. Tollenaere. The Electronegativity Equalization Method II: Applicability of Different Atomic Charge Schemes. J. Phys. Chem. A 2002, 106, 7895-7901. [Link] |
| [blc2003] | Patrick Bultinck, Wilfried Langenaeker, Ramon Carbó-Dorca, and Jan P. Tollenaere. Fast Calculation of Quantum Chemical Molecular Descriptors from the Electronegativity Equalization Method. J. Chem. Inf. Comput. Sci. 2003, 43, 422-428. [Link] |
Footnotes
| [1] | Spectrophore is a registered trademark of Silicos NV. |