SVG 2D depiction (svg)
Scalable Vector Graphics 2D rendering of molecular structure.
When called from commandline or GUI or otherwise via Convert(), single molecules are displayed at a fixed scale, as in normal diagrams, but multiple molecules are displayed in a table which expands to fill the containing element, such as a browser window. When WriteMolecule() is called directly, without going through WriteChemObject, e.g. via OBConversion::Write(), a fixed size image by default 200 x 200px containing a single molecule is written. The size can be specified by the P output option.
Multiple molecules are displayed in a grid of dimensions specified by
the -xr and -xc options (number of rows and columns respectively
and --rows, --cols with babel).
When displayed in most modern browsers, like Firefox, there is
javascript support for zooming (with the mouse wheel)
and panning (by dragging with the left mouse button).
If both -xr and -xc are specified, they define the maximum number of
molecules that are displayed.
If only one of them is displayed, then the other is calculated so that
ALL the molecules are displayed.
If neither are specified, all the molecules are output in an
approximately square table.
By default, 2D atom coordinates are generated (using gen2D) unless they
are already present. This can be slow with a large number of molecules.
(3D coordinates are ignored.) Include --gen2D explicitly if you wish
any existing 2D coordinates to be recalculated.
Note
This is a write-only format.
Write Options
| -u | no element-specific atom coloring Use this option to produce a black and white diagram |
| -U | do not use internally-specified color e.g. atom color read from cml or generated by internal code |
| -b <color> | background color, default white e.g |
| -B <color> | bond color, default black e.g |
| -C | do not draw terminal C (and attached H) explicitly The default is to draw all hetero atoms and terminal C explicitly, together with their attched hydrogens. |
| -a | draw all carbon atoms So propane would display as H3C-CH2-CH3 |
| -d | do not display molecule name |
| -s | use asymmetric double bonds |
| -t | use thicker lines |
| -e | embed molecule as CML OpenBabel can read the resulting svg file as a cml file. |
| -p <num> | px Scale to bond length(single mol only) |
| -P <num> | px Single mol in defined size image The General option –px # is an alternative to the above. |
| -c <num> | number of columns in table |
| -c | ols<num> number of columns in table(not displayed in GUI) |
| -r <num> | number of rows in table |
| -r | ows<num> number of rows in table(not displayed in GUI) |
| -N <num> | max number objects to be output |
| -l | draw grid lines |
| -h <condition> | highlight mol if condition is met The condition can use descriptors and properties,
See documentation on |
| -i | add index to each atom These indices are those in sd or mol files and correspond to the order of atoms in a SMILES string. |
| -j | do not embed javascript Javascript is not usually embedded if there is only one molecule,
but it is if the rows and columns have been specified as 1: |
| -x | omit XML declaration (not displayed in GUI) Useful if the output is to be embedded in another xml file. |
| -X | All atoms are explicitly declared Useful if we don’t want any extra hydrogens drawn to fill the valence. |
| -A | display aliases, if present This applies to structures which have an alternative, usually shorter, representation already present. This might have been input from an A or S superatom entry in an sd or mol file, or can be generated using the –genalias option. For example: obabel -:"c1cc(C=O)ccc1C(=O)O" -O out.svg
--genalias -xA
would add a aliases COOH and CHO to represent the carboxyl and aldehyde groups and would display them as such in the svg diagram. The aliases which are recognized are in data/superatom.txt, which can be edited. |
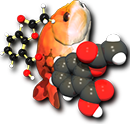
| -S | Ball and stick depiction of molecules Depicts the molecules as balls and sticks instead of the normal line style. |
Comments
If the input molecule(s) contain explicit hydrogen, you could consider
improving the appearance of the diagram by adding an option -d to make
it implicit. Hydrogen on hetero atoms and on explicitly drawn C is
always shown.
For example, if input.smi had 10 molecules:
obabel input.smi -O out.svg -xb -xC -xe
would produce a svg file with a black background, with no explicit terminal carbon, and with an embedded cml representation of each molecule. The structures would be in two rows of four and one row of two.